So, in my ongoing science communication efforts, I have been experimenting with visual formats for summarizing research/complex scientific concepts in simple-to-understand and fun ways.
Thus, my #ResearchMonday series on Instagram (which, of course, features #ResearchCat). It was during the last live Twitter Chat with our Science Communication Journal Club that I realized something: participants were sharing amazing sources and articles on the topic, but I absolutely knew I was not going to read them in the nearest future considering other priorities. That’s when I wished there could be some simple memes or visual summaries of key points i’d find useful (and that would truly encourage me to read the rest of the paper).
I very much like Instagram’s swiping posts, since it’s fantastic for self-paced story telling. Thus, this is where I’ve been playing with simple overviews of research articles. Click on each to go to see them:
Note: If new to Instagram, hover over the image & note the small arrow buttons on its sides (<) and (>). Click these to swipe through the post!
So far, I’ve been choosing papers I have most expertise in- health and nutrition. However, as you can see I’ve attempted to cover some very different topics as well (conscious AI!) The format is most definitely NOT set in stone, and I’d love any feedback on improvements.
So this June I was invited to collaborate on a new exciting project: a Science Communication Journal Club! Since graduating in May, I already took the initiative to develop more science communication skills.. thus I joined immediately! 🎓
Meet our team!
What is the journal club all about? From our website:
Science Communication Journal Club is aimed at easing the overwhelm associated with your science outreach responsibilities.We summarize the latest peer reviewed literature as well as reports and surveys and deliver them to you in the form of regular Twitter chats and blog articles.
This week, we had our first twitter chat, hosted by Dr. Sherry Nouraini – the club’s creator! The topic was Becoming a “Nerd of Trust” on Facebook (and we discussed this paper),
Twitter chats can be overwhelming to follow, so I also did a live video on my Instagram page 🎥. I was curious to see if this format adds anything useful, and I believe it did! If someone doesn’t have time to closely follow a busy Twitter conversation for the entire hour, they can tune into the live video while multitasking. + you can make the livestream be viewable for 24 hours! So you can always watch it a bit later.
In the livestream, I summarized the paper, and then expanded on some of the posts in the chat (as well as my own answers and interpretations of the paper). I believe it’s a great accompaniment to the chat and I plan to do the same next month!👍
My Twitter/Instagram setup! I had the livestream going on my iphone, TwitterDeck on my Mac, and also opened @scicomm_jc Twitter on my iPad
Take-home points
Now, there will be a summary post on this month’s Twitter conversation soon (posted on the club’s website), but here’s my short overview:
Facebook can be a FANTASTIC intervention point to dispel scientific misconceptions, because so many people use it for news and to share articles.. many of them being poor sources. And you as a scientist have an advantage- people in your FB network actually KNOW you personally, so we’d expect they trust your expertise. And yet….. I feel like some serious barriers for scientists to use FB are:
Time commitment (indeed! the article discusses this a lot)
Cognitive burden (i stress this!! Would you rather engage the public on Twitter or your own relatives and friends?? After all, you can simply block rude individuals on Twitter and forget about them.. But things can get exhausting with family, especially on controversial topics like genetic engineering of foods)
Lack of incentives (both the paper and I emphasize this strongly). See:
I’ve been doing a lot of job applications lately, and some of them specifically ask for my Twitter account. So they surely do care whether you are engaged in science communication. Well, nobody’s going to ask you to show your personal Facebook account- so unfortunately Twitter provides you with more incentives from this perspective.
EXCITED to have my second science communication video out today!
This was a collaboration with ASU’s Risk Innovation Lab, as I co-wrote the script with Dr. Maynard. In addition, I used the great video making setup in the lab’s facilities (instead of suffering in my own home with a small unstable whiteboard and terrible lighting).
Step 1: Record the drawings
Step 2: Record the voiceover
The Process. To produce such videos, you first need a good to-the-point succinct script. This is the toughest part for me personally. Once you have that, you need to create the drawings to go along (I enjoy this part the most, though that’s not the case for everyone). Then you’re ready to film!
If you have professional lighting equipment, great camera, and a sturdy whiteboard, you can do it in < 2 hrs, which is how long it took me (my first video took much much longer- in fact I had to re-record sections on the next day). This part is probably the most tedious and frustrating– for one, try writing in a straight line and with good enough handwriting!! Then you have to record the voiceover- so, read the script you wrote. This can take many tries, but it seems like the simplest part to me!
Finally, you need to edit the video- so, take your recordings and synchronize them so that the images go with the script perfectly. This is not as horrible as you might imagine (iMovie makes it straightforward), but it does take some time. Overall, this video took me about 7 hours to make. My previous one (HERE) took about 16!!
I am very happy with this work (especially the epi detective with a sizable mustache), but I wonder about one element. Originally, I wrote the p-value explanation a bit longer. We then shortened it, but I am curious which version does a better job explaining the concept. Here’s the first writeup:
“One standard practice in analyzing data is to look at the P-VLUE (or probability value) to determine if the findings are true or are simply due to chance.
For this, a p-value cut off is set at 0.05: this means that the probability of findings being caused by random chance is 5% or less. P-values above this 0.05 threshold, meaning the probability of chance findings is more than 5%, are considered NOT statistically significant.
In other words: researchers across various scientific fields have arbitrarily decided that out of 100 findings, they are comfortable accepting that 5 of those will actually not be true but will be caused by random variations. And this amount of error is the most they are willing to accept (thus the 0.05 cutoff value).”
So, which explanation leaves a non-expert with a better understanding (in the video, it starts at 4:13)? Let me know if you have an opinion, because I honestly can’t tell which is more effective.
Sooo it has been accomplished! I have been awarded my PhD in Global Health from Arizona State University.. It’s been a long journey from post-USSR Ukraine to receiving one of the highest honors worldwide- a Doctor of Philosophy degree from a such a fantastic and innovative American institution as ASU!!
Dr. Hruschka was in Bangladesh so I was hooded by the amazing Dr. Jehn!
Families! My parents (right around me) flew from Ukraine for this 🙂
With Dr. Hruschka (right; my mentor) and Joe Hackman (left; my colleague!)
This summer I will be working with the Risk Innovation Lab at ASU on publishing a couple of perspectives on science and health. I’m extremely excited about this opportunity to get into science communication and hope to post more about that soon! In the meantime, some of my other publications:
So.. Yesterday I defended my doctoral dissertation. I’m not sure I believe this yet, but I do think i’m not dreaming right now. Almost teared up as my committee members shook my hand and congratulated me. What a journey!
Lay Theories of Healthy Eating: Insights from Cross-Cultural Comparison
I thank my committee for all the advice and support given yesterday: Daniel Hruschka, Alexandra Brewis, and Meg Bruening. I also could not have finished all the data collection (>80 lengthy interviews!) on time on my own without my 8 apprentices. My undergraduate assistants have been quite amazing.
In terms of the bigger picture- there are so many people to thank, so many that have played key roles in my academic journey. The foundation was laid down when I was 5 years old when, despite having to go to the assigned elementary school, my grandmother and parents managed to enroll me into an English-specialized school on the other end of the city. This was right after USSR ended and Ukraine was newly independent and chaotic… Yet my family had the foresight in those rough times to send me on the ambitious path in life!
I do plan to post a short video with some results of my dissertation work soon, since many of my students and colleagues couldn’t be there. Stay tuned!
The annual American Anthropological Association (AAA) meeting has ended! This is my 3rd year attending and it is still as crazy, overwhelming, and fun at the first time. 🙂
The 2015 meeting was in Denver, CO (gorgeous gorgeous city! My first time there) and I wanted to write down a couple of impressions and things learned from this year’s event.
SO, first of all- what I presented on.. This September I began collecting my dissertation data. I also got accepted for a poster session for the Anthropology Society for Food & Nutrition at the AAA, thus I knew I’d better have an interesting poster ready by mid November. :S
Finishing up interviews while in Finland!
It was rushed & stressful (when is it not?), I had to put together the poster & print it from Finland (I was traveling constantly before the AAAs!) but it got done.
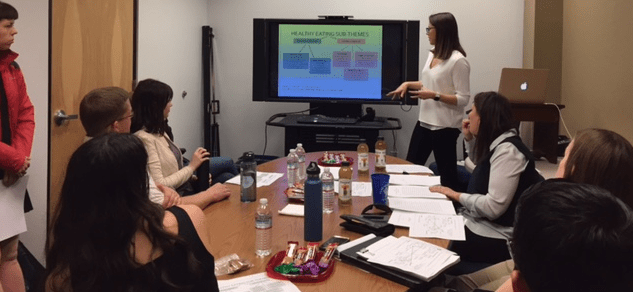
My poster showed some preliminary results of how people (from mostly urban southwestern US) talk about healthy eating. I mostly focused on results from the pile sorting interview (presenting visual “maps” of how the 42 cars people sorted can be represented in 2 dimensions when averaged over 30 participants). I also talked about the several distinct “theories” of healthy eating that emerged from the interviews (using Q sort agreement rankings). I got good feedback and some very crucial suggestions for further work!
Two hours of poster talking! :S Exhausting but great.
Of course, I also attended a bunch of amazing talks! Some of my favorites are summarized here:
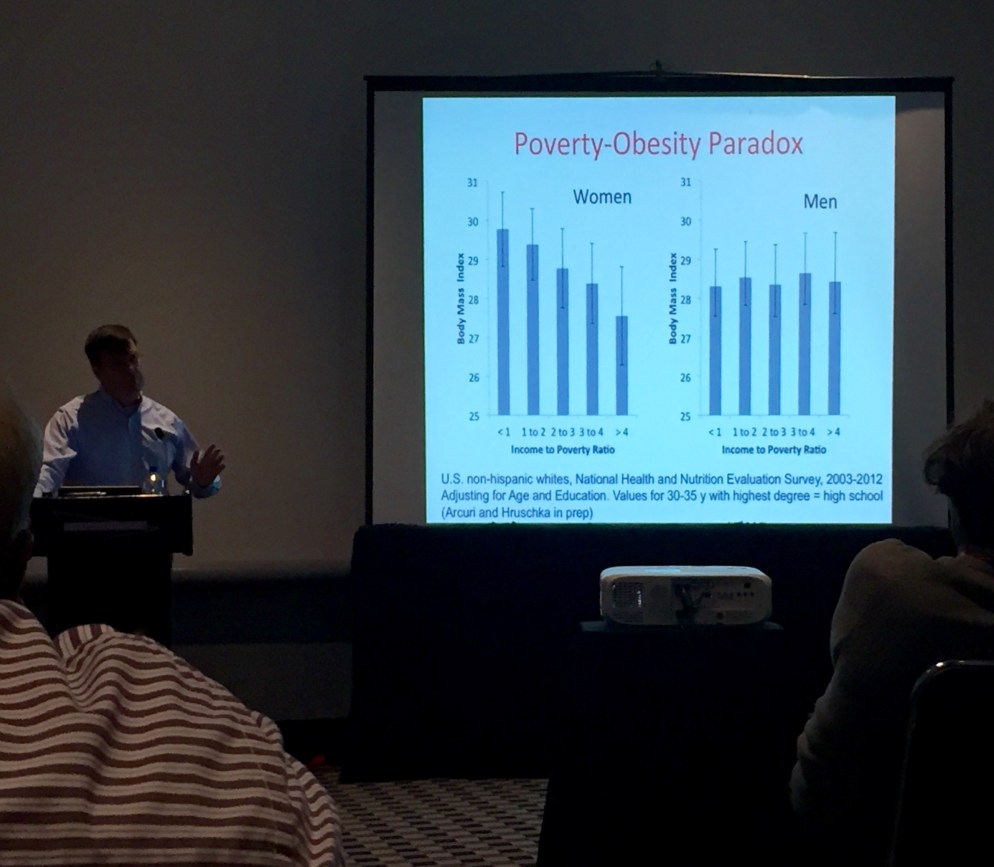
Dr. Hruschka’s talk in the Environmental Anthropology session was one of the best (he is also my PhD committee chair :P). In his presentation, he mentioned the highly fashionable explanatory model called the reverse gradient. This is an observed pattern in the US (& other high-income countries) where poor women have higher levels of fat (on average) than women who are more wealthy (this is reversed when compared to the REST of the planet, where increasing resources correlate with increases in body weight).
Many assume it has to do with poverty and not having time and resources to eat well and exercise. But actually, a great deal of data supports a different explanation: the body capital hypothesis. This hypothesis proposed that the anti-fat discrimination in marriage and jobs actually limits the economic mobility of people (particularly females) who have more body fat. So- husbands and employees seem to discriminate against heavier women.
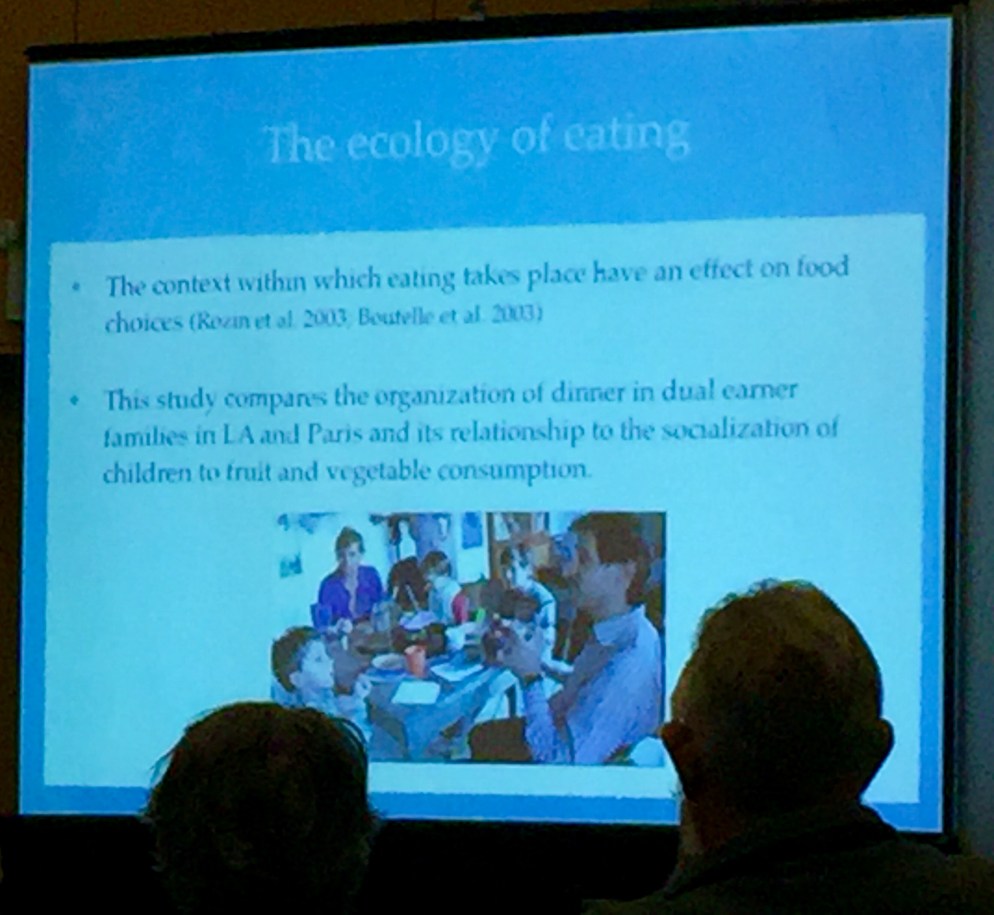
Another cool talk I heard was by Dr. Tamar Kremer-Sadlik (UCLA)who looked at the “ecology of eating perspectives” or the context in which eating takes place. Her study video recorded typical dinners in US and French families. They noticed that the existence of courses (so like a salad, main dish, dessert) reduced competition between foods and resulted in kids eating more vegetables. In other words- if your dinner table’s meal structure has few divisions into course (US families tended to have a single course + dessert, so all foods were served together), the presence of vegetables an be easily overshadowed by everything else available. In order to “share” a meal, you need to collaborate- if you have a single course, that collaboration exists whether you specifically eat the vegetable part of the dish or not (as you take some of the food offered).
In the French family dinners, they saw a lot more division into courses (starter, main, salad, cheese, yoghurt and fruit). To be collaborative during each course, one has to eat some of whatever is served at each course. If most of the courses include vegetables, the kids would overall eat a lot more vegetables over dinner. To quantify this difference: 47% of American kids didn’t touch vegetables, while only 10% of French kids didn’t.
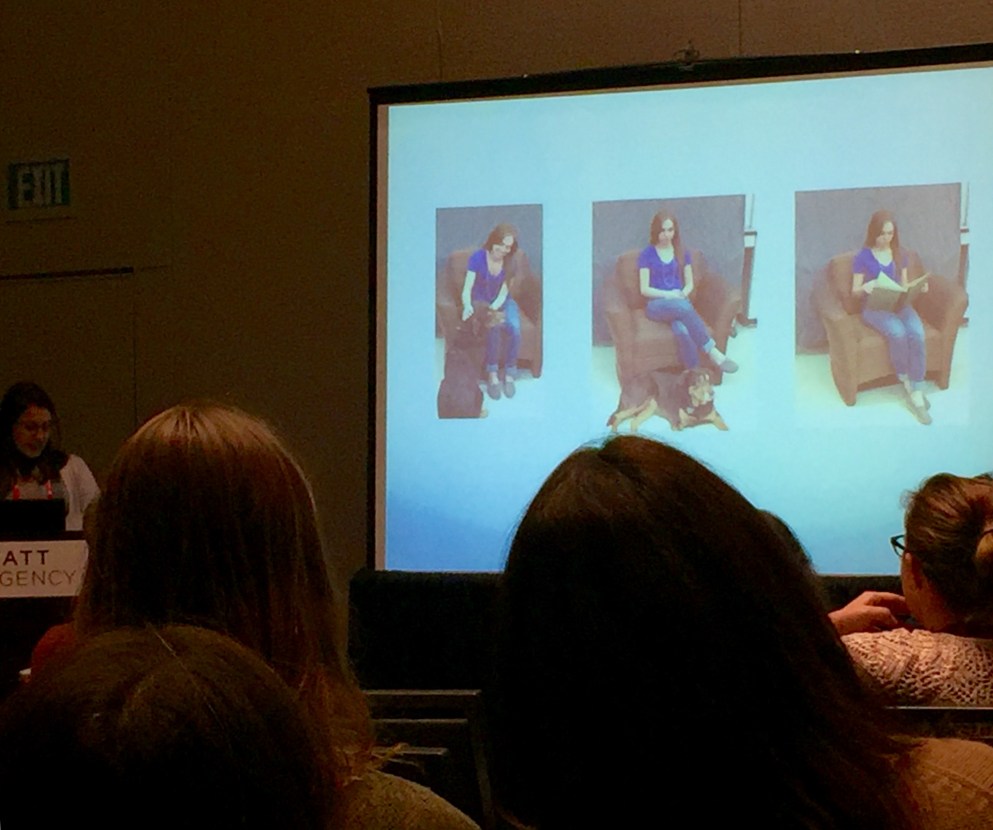
One last fun lecture I went to was called “Pet Ownership as Cues of Character” by a group from University of Colorado Springs (Evolutionary Anthropology session). They began by saying that many studies have found that women and men attenuate to cues of attractiveness differently: women seem to pay more attention to cues of character os success. For example, one study showed that women rated men paying positive attention to an infant as more attractive, while men did not rate photos of women differently (whether they were paying attention to infant or ignoring it).
So this group hypothesized that perhaps women conflate cues of parenting ability into attractiveness. They tested it with pet ownership, instead of having a baby! They asked US respondents to rate photos of individuals in 3 scenarios: paying attention to a dog, ignoring the dog, and a neutral/reading book photo. To their surprise, they found that only MEN rated women as MORE attractive and as MORE desirable partners when shown the photo where women pay positive attention to the pet.Women were not rating males with pets as more attractive. While the study could have some important flaws, that’s a pretty cool and intriguing outcome.
There were a LOT more talks I found fascinating, but it is too overwhelming to mention them all 🙂 #AAA2015


 Association (AAA) meeting has ended! This is my 3rd year attending and it is still as crazy, overwhelming, and fun at the first time. 🙂