So, in my ongoing science communication efforts, I have been experimenting with visual formats for summarizing research/complex scientific concepts in simple-to-understand and fun ways.
Thus, my #ResearchMonday series on Instagram (which, of course, features #ResearchCat). It was during the last live Twitter Chat with our Science Communication Journal Club that I realized something: participants were sharing amazing sources and articles on the topic, but I absolutely knew I was not going to read them in the nearest future considering other priorities. That’s when I wished there could be some simple memes or visual summaries of key points i’d find useful (and that would truly encourage me to read the rest of the paper).
I very much like Instagram’s swiping posts, since it’s fantastic for self-paced story telling. Thus, this is where I’ve been playing with simple overviews of research articles. Click on each to go to see them:
Note: If new to Instagram, hover over the image & note the small arrow buttons on its sides (<) and (>). Click these to swipe through the post!
So far, I’ve been choosing papers I have most expertise in- health and nutrition. However, as you can see I’ve attempted to cover some very different topics as well (conscious AI!) The format is most definitely NOT set in stone, and I’d love any feedback on improvements.
So this June I was invited to collaborate on a new exciting project: a Science Communication Journal Club! Since graduating in May, I already took the initiative to develop more science communication skills.. thus I joined immediately! 🎓
Meet our team!
What is the journal club all about? From our website:
Science Communication Journal Club is aimed at easing the overwhelm associated with your science outreach responsibilities.We summarize the latest peer reviewed literature as well as reports and surveys and deliver them to you in the form of regular Twitter chats and blog articles.
This week, we had our first twitter chat, hosted by Dr. Sherry Nouraini – the club’s creator! The topic was Becoming a “Nerd of Trust” on Facebook (and we discussed this paper),
Twitter chats can be overwhelming to follow, so I also did a live video on my Instagram page 🎥. I was curious to see if this format adds anything useful, and I believe it did! If someone doesn’t have time to closely follow a busy Twitter conversation for the entire hour, they can tune into the live video while multitasking. + you can make the livestream be viewable for 24 hours! So you can always watch it a bit later.
In the livestream, I summarized the paper, and then expanded on some of the posts in the chat (as well as my own answers and interpretations of the paper). I believe it’s a great accompaniment to the chat and I plan to do the same next month!👍
My Twitter/Instagram setup! I had the livestream going on my iphone, TwitterDeck on my Mac, and also opened @scicomm_jc Twitter on my iPad
Take-home points
Now, there will be a summary post on this month’s Twitter conversation soon (posted on the club’s website), but here’s my short overview:
Facebook can be a FANTASTIC intervention point to dispel scientific misconceptions, because so many people use it for news and to share articles.. many of them being poor sources. And you as a scientist have an advantage- people in your FB network actually KNOW you personally, so we’d expect they trust your expertise. And yet….. I feel like some serious barriers for scientists to use FB are:
Time commitment (indeed! the article discusses this a lot)
Cognitive burden (i stress this!! Would you rather engage the public on Twitter or your own relatives and friends?? After all, you can simply block rude individuals on Twitter and forget about them.. But things can get exhausting with family, especially on controversial topics like genetic engineering of foods)
Lack of incentives (both the paper and I emphasize this strongly). See:
I’ve been doing a lot of job applications lately, and some of them specifically ask for my Twitter account. So they surely do care whether you are engaged in science communication. Well, nobody’s going to ask you to show your personal Facebook account- so unfortunately Twitter provides you with more incentives from this perspective.
EXCITED to have my second science communication video out today!
This was a collaboration with ASU’s Risk Innovation Lab, as I co-wrote the script with Dr. Maynard. In addition, I used the great video making setup in the lab’s facilities (instead of suffering in my own home with a small unstable whiteboard and terrible lighting).
Step 1: Record the drawings
Step 2: Record the voiceover
The Process. To produce such videos, you first need a good to-the-point succinct script. This is the toughest part for me personally. Once you have that, you need to create the drawings to go along (I enjoy this part the most, though that’s not the case for everyone). Then you’re ready to film!
If you have professional lighting equipment, great camera, and a sturdy whiteboard, you can do it in < 2 hrs, which is how long it took me (my first video took much much longer- in fact I had to re-record sections on the next day). This part is probably the most tedious and frustrating– for one, try writing in a straight line and with good enough handwriting!! Then you have to record the voiceover- so, read the script you wrote. This can take many tries, but it seems like the simplest part to me!
Finally, you need to edit the video- so, take your recordings and synchronize them so that the images go with the script perfectly. This is not as horrible as you might imagine (iMovie makes it straightforward), but it does take some time. Overall, this video took me about 7 hours to make. My previous one (HERE) took about 16!!
I am very happy with this work (especially the epi detective with a sizable mustache), but I wonder about one element. Originally, I wrote the p-value explanation a bit longer. We then shortened it, but I am curious which version does a better job explaining the concept. Here’s the first writeup:
“One standard practice in analyzing data is to look at the P-VLUE (or probability value) to determine if the findings are true or are simply due to chance.
For this, a p-value cut off is set at 0.05: this means that the probability of findings being caused by random chance is 5% or less. P-values above this 0.05 threshold, meaning the probability of chance findings is more than 5%, are considered NOT statistically significant.
In other words: researchers across various scientific fields have arbitrarily decided that out of 100 findings, they are comfortable accepting that 5 of those will actually not be true but will be caused by random variations. And this amount of error is the most they are willing to accept (thus the 0.05 cutoff value).”
So, which explanation leaves a non-expert with a better understanding (in the video, it starts at 4:13)? Let me know if you have an opinion, because I honestly can’t tell which is more effective.
I made my first science communication video! It took me only ~ 15 hours, no big deal 🙂
It won’t be as time consuming from now on..but there is a lot of work involved nevertheless: writing a good concise script, sketching all the images that could go along with it, setting up the recording (can be so tricky!), recording yourself draw (and redraw.. and redraw) every frame.. Then editing all those videos, recording the audio (and re-recording..and re-recording again), and finally matching video to audio (as well as finding some free background tunes to go along!). Check it out:
I chose this topic because i’ve been craving to cover it for some time now. Since my dissertation work focused on lay models of healthy eating across cultures (so: people’s beliefs about what it means to eat well), I did not address the scientific accuracy of any perceptions. But oh I wanted to! And that is because one of the most fascinating findings from my interviews was that eastern European (EE) participants considered “how you eat” (i call these “eating styles”) to be more important for health than American respondents.
Eastern Europeans (EE) judged statements about EATING STYLES (such as time of eating) as more important for health…
Specifically, EE participants rated the statement “it is important to avoid eating late in the day” significantly higher than Americans (and this was true from my past survey-based studies!).
This is what the image below shows, but let me explain the method behind it: I conducted >70 interviews in the U.S., Romania, and Ukraine where I asked people to look at 42 different statements about “healthy eating”. Among other activities, they had to indicate how much they personally agreed with each statement (from “4” agree completely to “-4” disagree completely; I used Q Methodology for this, by the way ).
So, between Americans and eastern Europeans, 1 statement about eating styles (or “context” as I referred to it in this chart) that was more important for the latter: not eating late.
So, out of ALL 42 cards, only “avoid eating late in the day” got a statistically significantly higher agreement score from eastern Europeans. AND when prompted to explain their views, my respondents gave an explanation that was amazingly close to the actual science of circadian rhythms!!
Why did EE folks seem to know about circadian rhythms way more than Americans?
I didn’t analyze why EE folks seem to know about circadian rhythms way more than Americans, but this knowledge is something they knew from childhood.. It was part of general recommendations and “common sense” while growing up in the USSR. It fact, importance of eating styles is prominent in traditional beliefs about health (like in Japan and China).. perhaps all the focus on nutrients that’s possible with modern science is taking our attention away from this old wisdom?
perhaps all the focus on nutrients that’s possible with modern science is taking our attention away from this old wisdom
Now that nutrition science is paying increasingly more attention to eating styles as well (CHRONO-NUTRITION!), I assume American folks will begin incorporating beliefs about importance of food timing also!
Last week our lab held the last meeting for the semester. And to celebrate a great productive year we had… chocolate-covered insects. It’s a bizarre tradition carried over from ~1 ago when the lab studied disgust towards eating different animals 🙂
I will miss working with our fantastic undergraduate apprentices! This semester we focused on 2 projects: 1)using process tracing software to examine how much different types of information matter for making food healthiness judgments, and 2) measuring household wealth (& how it affects health) across the world.
The first project was my “baby”: after mostly survey and interview work over the past several semesters, I really wanted to try learning a new method. I both hated and loved it: the learning curve can be brutal, but once we got some preliminary results things felt worth it!
We used a process tracing software that allows you to analyze the decision making process of participants. We used this program to have people rate different foods on healthiness after checking some information about them. We gave them two types of information- positive (e.g. presence of vitamins) and negative (e.g. presence of artificial ingredients). Our pilot confirmed the hypothesis that people do in fact spend more time checking out negative information! (See chart: time/Y axis is in milliseconds)
For the other project I spent the last 7 MONTHS harmonizing and cataloguing the many assets and services used to assess household wealth in low-income countries. The main question for this project is to examine how economic inequalities shape global health outcomes (e.g. obesity in adults and child growth) and to test whether different pathways to wealth might shape these things differently. I’m happy to announce that we in fact DID finish all the data harmonization and merging (it was no spring picnic) and the lab will now begin analyzing the data and examining different dimensions of wealth.
Uhh I will miss this amazing team for sure.. but hey- in about a week I graduate! What a strange feeling it is!
My first encyclopedia chapter is finally published!
I was researching and writing this one while traveling across 3 countries this summer and collecting data, so the whole process was not necessarily a piece of cake. Thus, i’m extra pumped this is finally available! If you want to read the chapter but can’t access it, feel free to email me and i’ll send you the PDF 🙂 -> mvoytyuk (at) asu.edu
NOTE: It’s actually highly ironic for me to write on how cooking could have been instrumental in the evolution of our large brains- I spent 2 years as a highly motivated raw vegan! Indeed, I took several “raw cooking” and educational courses in different parts of the U.S. (Illinois, California), was a private raw “chef”, and taught raw veganism workshops for over a year at a food co-op I managed.
This chapter doesn’t actually comment on whether there could be health benefits to eating a diet higher in uncooked foods. It does focus on highlighting the fact that we appear to be particularly adapted to cooking. So, I’d say it does notsupport a 100% raw vegan diet as a worthy endeavor.
Click HERE for the encyclopedia page, and here is the short intro:
The disproportionately big human brain is a conundrum – it is larger than would be expected for a primate of our size, and it is a very energetically expensive organ. Since human basal metabolic rate (BMR) is not elevated to match such a big brain, the extra energy needed to sustain it suggests a dietary explanation. Feeding the large brain would likely require a shift to a high-quality diet: one comprised of energy-rich, easily digestible foods. This hypothesis is supported by a number of anatomical features: smaller teeth, jaws, stomachs, and a shorter large intestine. Two key elements of human subsistence – cooking and meat eating – have been proposed as a possible means of achieving this high-quality diet.
I went to a great talk at ASU’s Evolution & Medicine center, where Dr. Stearns from Yale University discussed tradeoffs 🙌🎓. I’d love to invest the rest of this day into summarizing what i’ve learned but i’ve got a dissertation to write, jobs to apply to, etc. etc… So a really short science communication bit is all i can manage!
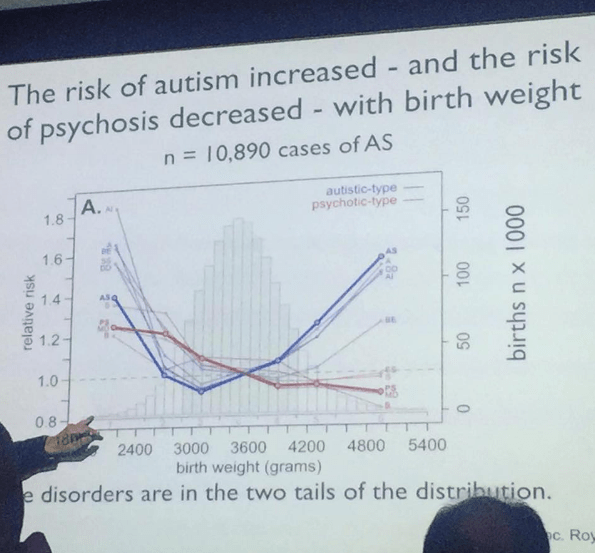
Short version: Look at this chart.. It shows how mental illness is a result of a conflict between paternal and maternal genes. Notice how autism and szchisophrenia manifest most at the extremes of a newborn’s birth weight.
Long version: “Imprinted brain theory” argues that maternal & paternal set of genes might have antagonistic reproductive interests: father “turns off” genes that down-regulate fetal growth, resulting in enhanced growth. Mother turns on these genes, inhibiting growth.. Both actions result in normal range of weight of the newborn.
The mother is 50% related to each of her offspring.
The logic behind conflicting interests from the parents is such: since a father is uncertain that a woman’s other and future children will be his, it may be in the father’s reproductive interest for his child to use mother’s resources MORE, while the mother’s interest (considering she’ll be 50% related to all her current and future children equally) is to limit this and have resources for future kids. With polygamous mating, offspring’s genes from the father will be selected to extract MORE from the mother, and maternal genes will be selected to resist such increased extraction of bodily resources.
To simplify: father needs current baby to use up as much of mother’s resources to grow bigger/stronger/have higher chance of future reproductive success because he can’t be sure her other kids will actually be his.
A conflict arises when action of one parent is cancelled by disrupting imprinting- so disruption of maternal interests would result in an uninhibited expression of paternal interests. Such disruptions result in abnormally low or high birth weight (along with other factors such as behavioral aspects- the extremes of which are considered mental illnesses). Extreme genomic imprinting in favor of MATERAL genes will result in lower birth weight, and is argued to cause psychosis (schizophrenia spectrum) while the opposite causing autism spectrum disorders. The chart above shows how such abnormalities in weight are indeed associated with autism & schizophrenia.
Most people don’t read original research articles…why would they? They might have an access fee or be too technical to comprehend for the normal lay person. Yet many websites report on results of those “recent studies”. I’ve seen many health websites sensationalize new super important work in peer reviewed journals.. just to realize that the journal it’s published in is rather suspicious.
Recent example: one anti-vaccine website posted a list of studies that apparently showed the danger of vaccinating. I wanted to read the very first article on that list and the website provided a PDF. I found myself thinking the results were a bit too extraordinary [see infographic towards the end of this post for HINTS on spotting a suspicious article] … I noticed it was published by some asian journal with a strange-looking website. I proceeded to search for this same article on Google Scholar and guess what? it did not exist there. That’s just fishy.
Certain journals have big names and high reputations and are easily recognized (especially by academics). I read a lot of fantastic research articles in Appetite, for example, on the psychology of eating. So we as a research community generally “know” what kinds of journals publish high quality science. YET, even researchers have to be careful to avoid trashy journals that have no standing in the scientific community.
What is a “bad” journal: one that publishes low quality work, basically; something that a high reputation journal with scientific standards would not consider publishing. Bad journals often publish anything for a fee, and while they state they are “peer reviewed”, nobody really does any good reviewing, if any (I even saw a case where one of the lister reviewers was a diseased academic). The peer review process is supposed to ensure that your work actually uses real data, appropriate methods, sound conclusions based on the results, etc. It’s supposed to protect us from reading and taking into consideration fake, unscientific, biased work.
Who publishes in these trashy journals? It can be young academics who are just trying to publish their research and get duped to pay a lot of money to one of these predatory journals. It can also be bad researchers with bad studies who could never get their trashy work into a good peer-reviewed journal in the first place (yet they can pay to publish, pay to announce this publication, and watch the internet sensationalize their misleading work).
One way to know a journal is high quality is to know the publisher is high quality (some famous ones are Elsevier, Springer). Also, some websites post a list of journals (as well as list of publishers) to avoid. Check out THIS BLOG. Both academics and public alike can be fooled by low quality journals- they often have legitimate-sounding titles, resembling prestigious journal titles; they have professional-looking websites, etc.
Great guide to spotting poor-quality journals!
Lastly, while a lot of bad research can be published in bad journals..some poor research can get published in decent ones. A poor study, though, will eventually be retracted. Please follow RETRACTION WATCH to be up-to-date with such work! Otherwise, you could be falsely spreading information about research that was low quality in the first place (e.g. good example is the Seralini rat study on GMO feed (read more here).
Since my research includes asking questions about why people think what they do about health, I spent a lot of time reading various discussion boards and comment sections on different health topics. In the last several days I’ve had such an overload of insane online discussions about vaccines, GMOs, and diets that I almost want to quit… And yet the often entertaining arguments keep me coming back! The science folks vs. lay folks debates are also interesting since I am myself an ex anti-science alternative health believer who has now “switched sides” on many issues (or as I prefer/hope to think: turned much more moderate in my views based on understanding scientific evidence better).
Have you ever seen a conversation between a “concerned mom/dad who follow their gut” and a “science proponent with experience in the lab” discussing vaccinations? It is sad and funny as you see things like these:
– science person providing links to peer-reviewed literature (really just abstracts, folks can’t access the full text most of the time), questioning parent’s credentials, attempting to explain herd immunity, claiming they lack understanding of science and suggesting to take an into to epidemiology course, blaming them for increasing rates of preventable disease…and as last resorting to calling them stupid, biased, etc.
– concerned parent shares links to blogs and anti-vaccine websites, calls the science person’s degree “useless”, emphasizes their credentials as a parent who “just knows” and does their research (via blogs and specific sites), and very often attacks the science guy/girl as being paid by Monsanto or FDA, being dogmatic and inflexible as their degree was provided by corrupt institutions, being stupid, etc.
Nobody ever appears to switch sides, understand where the other person is coming from, or take their evidence seriously. The process of reading such conversations is often sadly hilarious yet less often informative. But most importantly it shows people’s biases.


 And yet the often entertaining arguments keep me coming back! The science folks vs. lay folks debates are also interesting since I am myself an ex anti-science alternative health believer who has now “switched sides” on many issues (or as I prefer/hope to think: turned much more moderate in my views based on understanding scientific evidence better).